|
Prosticks Articles
蘋果日報 --- 九月三日
成交時間可計聚焦點
有讀者問,恒生指數並無成交量資料,乾坤燭圖如何得來?我們是用成交時間法來計算恒指的聚焦點及活躍區,電腦會跟蹤報價系統上的每個恒指價位,最頻密出現的,即聚焦點;最頻密出現的指數範圍,即活躍區。
成交時間法也可以用在股票上,此方法與成交量法相比,有幾個好處。首先,指數、貨幣並無成交量資料,成交時間法是唯一的選擇;其次,某些情況下,成交量資料不可作準,比如一些大手特別交易、轉倉等情況出現時。
假設某隻股票在開市時以100元裂口低開,2分鐘內立即有很大數量在100元轉手,
100萬股可能是隔夜斬倉盤。然後股價回升到110元,之後在110元附近窄幅波動,大約成交
80萬股。在這種情況下,雖然在100元的成交量比在110元的成交量多,但110
元才是真正的聚焦點。市場花在100元的時間大約2分鐘,而花在110元的則差不多是整個交易日。
測指數命中率高
按照研究結果,用時間成交量計算聚焦點,比成交量法更具說明力,在乾坤燭網站,兩種方法算出的聚焦點都有。
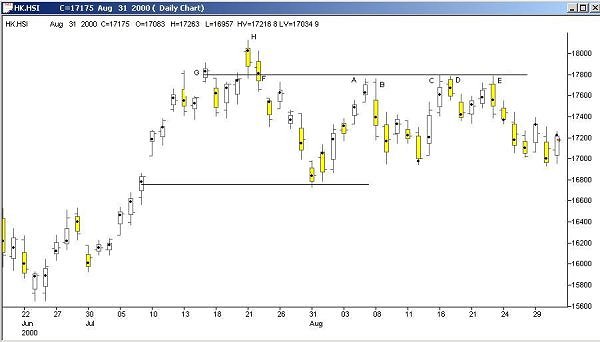
恒生指數(日線圖)
上圖是恒指的乾坤燭圖,8月份指數在16800點至17800
點整固,A、B、C、D和E是整固期間的高點,全部都接近G和F的聚焦點。即是說,每次指數一升到
17800點附近,源自於G和F的聚焦點處的沽售壓力就再次出現。F是指數在創出新高(H位)後,進入調整的第一支燭,即是說,指數創出新高後,來自大戶的大量沽盤殺入市場,特別是在F的聚焦點處。
假設回到E日,有無方法可以預測到,恒指升到G和F的聚焦點平台處,會遇阻而回,還是破位而上?請看下圖,在
E日,STC進入超買區且開始下跌,快線已跌低過慢線,說明市場缺乏上升動力,會遇阻而回。
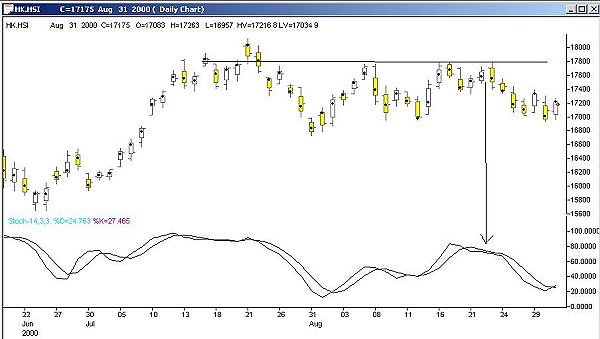
恒生指數(日線圖)
|