|
Prosticks Articles
信報 --- 八月二十八日
從趨勢線看長短期走勢
有經驗的外匯炒家,若想捕捉貨幣市場短線的趨勢及長線的炒賣範圍從中獲利,通常都會用到「趨勢線」這種流行工具。趨勢線分支持線和阻力線兩種。理論上,價格升到阻力線之上,上升趨勢即將形成;價格跌到支持線以下,下跌趨勢也應將出現。先簡單說明畫趨勢線的技巧,若連接相鄰的兩個低點,可以畫出一條支持線。看澳元兌美元的聚焦點線圖,是連接每天的聚焦點而成(圖一)。L1包含A、B、C、D四價低點,其中不止兩個,它應是一條強力有效的支持線。所以當價位在G處跌破此線後,隨即引來急挫。
L1作為強力有效的支持線的另一原因,是價格均衡移動理論的引伸。A-E-C
及C-F-G是寬度與高度頗為對稱的三角形。這兩個三角形都落在一條趨勢線時
,這條趨勢線值得信賴。
再看澳元兌美元的乾坤燭圖,L1是聚焦點支持線(同圖一的L1),L2是用傳統方法畫出的支持線,即是連接相鄰的最低位而成(圖二)。L1比L2更早被跌破,若使用聚焦點趨勢線,便可快人一步行動。目前絕大多數人使用的都是傳統趨勢線,如看到L2被跌破才加入沽貨大軍時,已不會沽到好價位。很明顯,聚焦點趨勢線的用家,比傳統趨勢線的用家更佔優勢。
有關乾坤燭的連載可在乾坤燭網站www.prosticks.com觀看。
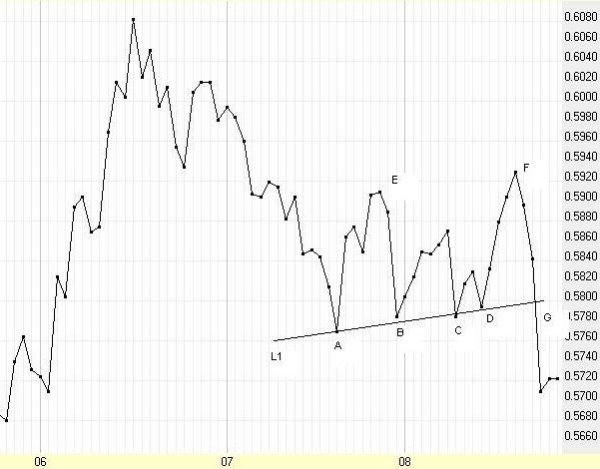
圖一 澳元兌美元聚焦點線圖
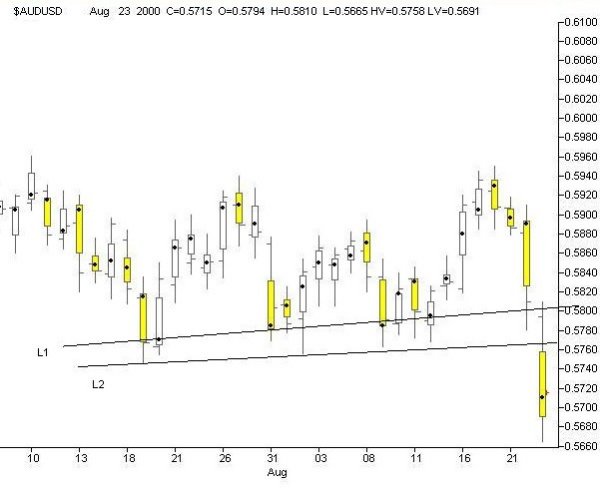
圖二 澳元兌美元乾坤燭圖
|