前言 市場技術員、技術分析員及圖表分析家利用圖表來分析股市價格的動向和預測未來的走勢,但圖表不應只限於圖表專家使用,基本分析員也能利用圖表,因為圖表化的歷史記錄更容易使基本分析員指出在股票價格上重要的事情(例如盈利、派息等),及更容易監察各股票過往的表現。 時段 圖表可以以不同的形式顯示,又可以即日圖、日圖、周圖及月圖來顯示。日圖的每一天是以當日每一個交易記錄的數據聚合為一個單一數據;而周線圖的每一周是以每一天的數據聚合為一個單一數據;至於月線圖的每一個月則以當月的每一周數據聚合為一個單一數據。時段的選擇是根據該金融產品的歷史和投資者的投資風格而定。 投資者通常透過即日圖及日圖預測短期價格趨勢。短期圖表的確能夠提供詳細及全面的數據,可是,其數據往往會因市價的急升/急降和裂口價格而產生大起大落。 相反,投資者常以周圖和月圖來預測長線價格趨勢。因為長線圖涵蓋了較長的時段,價格的動向並不會輕易地受外來的噪音影響。 除此之外,混合性的策略在市場上也經常被採用。投資者可使用長線圖表來分析大圍前景,或價格動向之趨勢;而短線圖則可用作為制定入市和出市位的指標。 圖表種類 技術員、技術分析員和圖表分析家最常使用的圖表分別有幾種,當中又以線圖最為簡單。繪畫方法是以每個時段的「收」價,用線相連而成。由於收市價在傳統分析上一向被視為重要價位,故此收市價遠比其他數據如開市價、最高價及最低價更具參考價值。 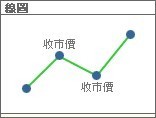  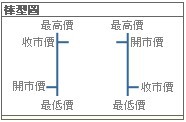 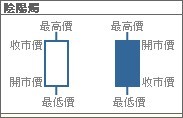
無可否認,棒形圖是現今最多投資者採用的圖表。每一支燭都以某時段的「開」「高」「低」「收」四個數據組成。以直線連接「高」和「低」價,組成柱身,然後在柱身的左邊以短橫線畫出「開」價,及在右邊以短橫線畫上「收」價。棒形圖之所以能夠穿過時間的巨輪,一直成為投資者最追捧的圖表,全因其燭身簡明地將市場重要的訊息顯示出來。跟線圖不同,棒形圖除了顯示收市價外,還能顯示出「開」「高」「低」價。在某些情況下,投資者為了避免圖表在視察上的混淆,會省略開市價。 此外,早在三百年以前,日本人已用陰陽燭來記錄米價變化,直至近年,陰陽燭圖更為普及化。正如上圖所示,陰陽燭的外形酷似棒形圖,同由「開」「高」「低」「收」四個價位組成,不同之處是兩者在表達「開」與「收」價的繪畫方法。首先,陰陽燭以白色燭身的陽燭代表收市價比開市價高,及以黑色燭身的陽燭代表收市價比開市價低,而燭身直線或遮暗之頂和底則分別代表最高價和最低價。近年陰陽燭日漸受技術分析信徒愛戴,原因是陰陽燭圖以顏色及幾何圖形表達升市和跌市,相比傳統的棒形圖多了一份視覺幫助。 價格比例 一直以來,技術員大多採用兩種技術來顯示圖表的價格比例──絕對比例圖表和對數比例圖表。絕對比例圖表利用相同的垂直距離來顯示價格,在全圖上每一個價格的單位比例是統一的。 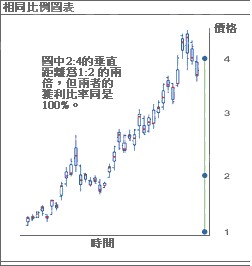  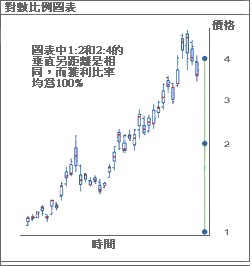
另一方面,對數比例圖表強調價格間的百分比變動。如上圖所示1至2和2至4的獲利比率同是100%。在對數比例中1至2和2至4的垂直距離是相同的,但在絕對比例中2至4則是1至2的兩倍。 既然兩者有著比例上的差異,究竟何時該用相同比例圖,又何時該用對數比例圖呢?大致來說,相同比例圖適用於窄幅上落的價格走勢,對於短期圖和短線炒家較為適合;相反,對數比例則較適合用在長線圖上,以及在一個有代表性改變的價格上(如九零年代科技網股爆破、經濟不景)。 圖表預測 坊間上提供的圖表技術分析種類琳瑯滿目,各有特色和優勝之處。眾人皆知,所有的技術分析同樣以過去的數據價格和活動為本。因此,投資者對技術分析種類的選擇均視乎個人的需要或投資方式而定。一個成功的投資者,能藉著個人認為有效的圖表工具來制定準確的買賣策略,從而達至高沽低買的投資目的。 |