前言 技術指標是運用一些數學程式,將過去的價格資料重新整理及計算。價格資料的組合可以為某時段的「開」「高」「低」「收」其中一個價位。現時的技術指標只利用收市價計算,與此同時,時間和成交量的元素也能注入技術指標中計算。 透過一些由時間系列制成的數據,投資者可輕易分析和比較出現時及過往的價格位置。技術指標的數據一般會顯示在圖表上或圖表以下位置,有時甚至以覆蓋圖表的形式來顯示。這些顯示方式,能有效掌握市況,測試後市。 事實上,技術指標是一種買賣時的輔助工具,使投資者能在市場上認清方向及強勢,不至於在買賣時作出太主觀的決定。投資者應謹記,技術指標是一種訊號,並不能直接對金融產品價格作出反應。 使用技術指標的三種主要原因是: - 提示:技術指標能提示價格的變動。如動向指標呈下跌,代表後市升穿支持位在即;相反,若動向指標出現底背馳,則提示投資者需注意價格變動,因阻力位被破的可能性很大,甚至有可能橫行。
- 確認:技術指標能進一步確認其他技術分析工具的結果。若破位在上方發生,而移動平均線也同時被穿過,即確認了價格很強;相反,若價格跌破支持位,相對強弱指數顯示超賣,賣家多於買家之情況可被確認。
- 預測:技術指標能助投資者預測一個較佳的入市/出市價位。不過,技術分析有時也會出現假訊號。因此,投資者應同時使用多於一種或以上的技術指標,避免招致損失 。
作為技術分析信徒,要領略怎樣分析技術指標是一件藝術多於科學的事情。技術指標可能適合應用在某些股票上,但不一定適合在其他。投資專家之所以能洞悉後市及揭穿假訊息,全因多年來的用心經營及經驗的累積。 最理想使用技術指標的方法是同時使用兩種或三種技術指標。同時使用過多的技術指標(如五種或以上),不但未能有效分析市況,還會引起買賣訊號上的混淆。舉例來說,相對強弱指數與威廉指數同是一種評估超買或超賣的指標,若同時使用此兩種指標,得出的數據不但顯得意義不大,還會增加了分析時的難度。 領導性與延緩性的技術指標 技術指標能在性質上被分為兩種──領導性和延緩性。 領導性技術指標領導性技術指標能幫助投資者預測未來價格的走勢,透過風險的增加來提供較大的回報。這些指標有時會出現假訊息和短線波動,是一種量度超買或超賣的指標。假設價格在這些指標出現超買訊號,代表升勢有可能放緩;相反,若出現超賣情況,則料跌勢將持續放緩。市場上常用的領導性技術指標有商品技術指標(CCI)、動向指標、相對強弱指數(RSI)、隨機指數及威廉指數。 延緩性技術指標是一種較多技術分析員用來參考的指標,以走勢跟隨指標而行,較適合使用於分析長期的走勢。透過延緩性技術指標所發出的數據,技術員可確認當前股價形勢,但不可預測未來趨勢。此類技術指標對於反彈或回調的市況並不敏感(如當市況走勢位處同一交易區),有時還可能變成落後指標。雖然如此,此類技術指標往往可令投資者在長線投資中獲得可觀的利潤。市場上常用的延緩性技術指標有簡單移動平均線(SMA)、指數移動平均線(EMA)及移動平均線匯聚背馳指標(MACD)。 擺動指標 擺動指標是技術指標的一種,波動範圍一般在於中間線的上下位置,或某時段內的同一位置。擺動指標通常徘徊在上介線和下介線範圍(超買或超賣),但持久力欠奉。相反,某些指標並不在中位線波動或只停留在同一範圍,如成交量平衡指數(OBV),其趨勢大都能得以長期維持。 一般來說,擺動指標可被分為兩類: 一為中位擺動指標,其數據經常於中位線以上或以下徘徊不定;二為邊界擺動指標,其波動範圍大多位於超買和超賣區。 移動平均匯聚背馳指標(MACD)是其中一個屬於中位擺動指標。MACD是由兩條沒有規限的高低指數平均線(通常用12天及26天之差值)計算出來。兩條平均線的差距愈大,持續時間便愈長。 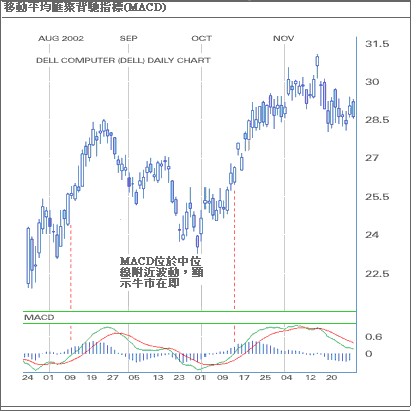
在邊界擺動指標方面,相對強弱指數(RSI)是一個較常見的例子。當RSI處於低位時,代表市場出現超賣現象;當RSI處於高位時,則代表市場出現超買現象。 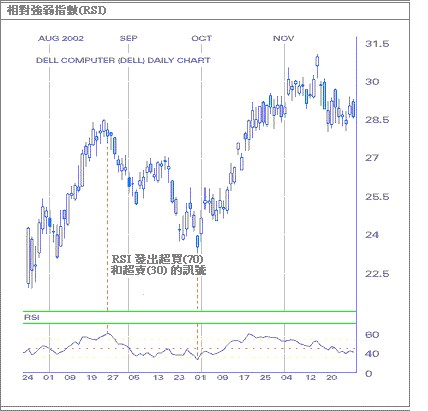
既然擺動指標有兩類之別,究竟在那些情況下該用中位擺動指標,又該在那些情況下使用上下擺動指標呢? 中位擺動指標最適合用於尋找市況強弱和方向。在一般情況下,數據位於中位線以上,暗示牛市在即,是利好現象。相反,數據於中位線以下,則暗示後市走勢將向下跌。除此之外,當指標穿過中位線,代表先前訊息已生效。舉例來說,前期訊號為買入訊號,而市價又升破中位線的話,前期訊號便能得以確認。 相反,邊界擺動指標最為適合炒家或短線投資者。此指標能在單邊市中分辨出超買和超賣,但不能在走勢上使用。由於邊界擺動指標能夠在超買區或超賣區徘徊一段較長的時間,假訊號的情況難免發生。事實上,超買/超賣並不一定代表買入及賣出的最佳時候。故此,此擺動指標並不適用於研究走勢。舉例來說,若市況上升力強勁,於超賣區入市比在超買區出市更有利可圖。此時,應將超買和超賣的情況視作為價格將到達極限的警告。 背馳訊號 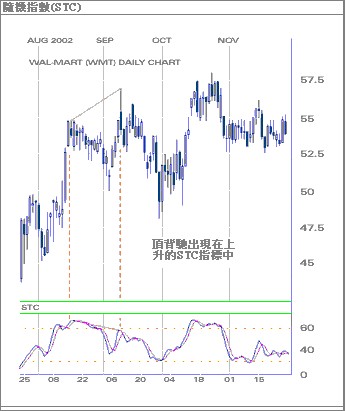  背馳訊號為現今技術分析上最強和最廣受認同的概念。其主要概念均能應用大多數技術指標所發出的買賣訊號。背馳訊號能有效幫助投資者辨認大市的轉勢,及籍著其他技術指標來確認買入/賣出訊號。 背馳訊號為現今技術分析上最強和最廣受認同的概念。其主要概念均能應用大多數技術指標所發出的買賣訊號。背馳訊號能有效幫助投資者辨認大市的轉勢,及籍著其他技術指標來確認買入/賣出訊號。
在背馳訊號中,有頂與底背馳之分。一般來說,當技術指標上升,市況卻正在下跌,便會出現頂背馳。另外,當技術指標下跌,市況卻正在上升,底背馳便會出現。 指標的應用 要成功地應用擺動指標訊號來制定及分析在股票交易中的買賣策略,投資者必須觀看多種訊號的結果。分辨買入/賣出訊號的標準能以三種不同的技術指標來釐定。舉例來說,當相對強弱指數(RSI)進入超賣狀況,出現頂背馳,及市況已升穿移動平均線時,為利好現象。根據以上準則,投資者在決定買入/賣出時的信心大為增強,同時也能減低在個別擺動指標所發出的假訊息。 擺動指標能有效幫助分析圖表形態,確立支持/阻力位和趨勢,還可配合其他技術指標工具同時使用。擺動指標的數值和訊息會隨著不同的市況有所改變。因此,配合擺動指標和其他技術分析來使用,成功獲利的機會更為鞏固。 |